Rain Data for 400 Mesa Road
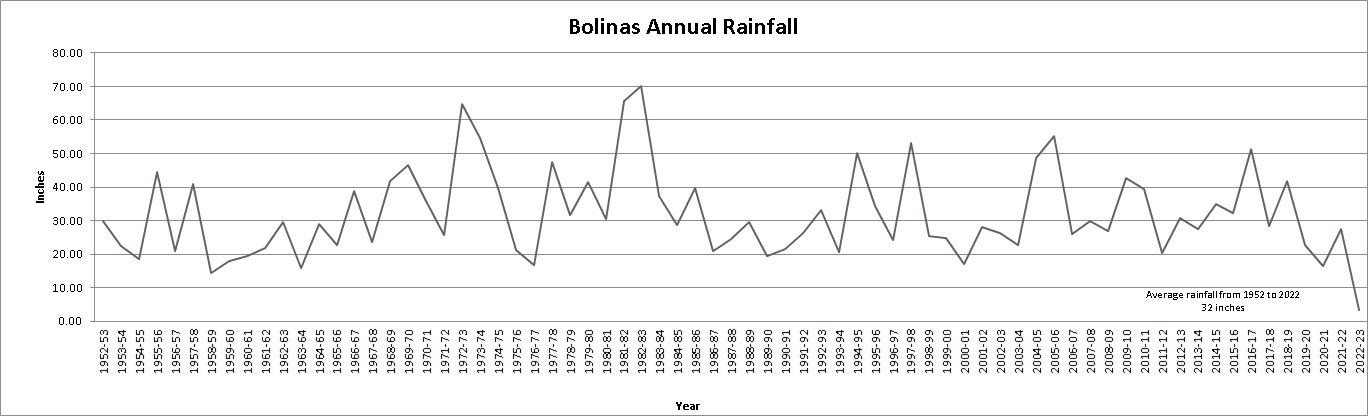
Above is a graph of rainfall between 1952-2022 that was originally created by Bobbi Kimball. To see a detailed accounting of the monthly rainfall totals for Bolinas since 1952 click here: July 1952 – March 2024 (These totals are not official totals, rather they were taken by individuals in the community and are subject to some margin of error.)
Monthly Totals for 2023/24
July 2023 – 0.00 inches
August 2023 – 0.34 inches
September 2023 – 0.69 inches
October 2023 – 1.34 inches
November 2023 – 3.71 inches
December 2023 – 5.90 inches
January 2024 – 6.95 inches
February 2024 – 7.59 inches
March 2024 – 5.70 inches
April 2024
May 2024
June 2024
Rainfall for 2023-24 rain year – 32.22 inches so far
Monthly totals for 2022/23
July 2022 – .70 inches
August 2022 – .23 inches
September 2022 – .45 inches
October 2022 – .03 inches
November 2022 – 1.97 inches
December 2022 – 9.44 inches
January 2023 – 12.35 inches
February 2023 – 3.11 inches
March 2023 – 9.51 inches
April 2023 – .48 inches
May 2023 – 1.00 inches
June 2023 – .10 inches
Rainfall for 2022-23 rain year – 39.37 inches